
Dynamic Analysis of Calcium and Oxalic Acid Content in Different Varieties of Chenopodium quinoa Leaves During Growth Period
-
摘要:目的
为了探明藜麦 Chenopodium quinoa 等藜属 Chenopodium 植物叶片中钙和草酸的含量,为藜麦菜的科学食用提供技术参考。
方法以浙江省主要栽培的‘陇藜1号’Ch. Quinoa‘Longli 1’‘青藜4号’Ch. Quinoa ‘Qingli 4’‘冀藜2号’Ch. Quinoa ‘Jili 2’和红藜 Chenopodium formosanum 4 个品种(种)为研究对象,对可食用期内叶片中不同形态的钙和草酸含量进行了测定分析。
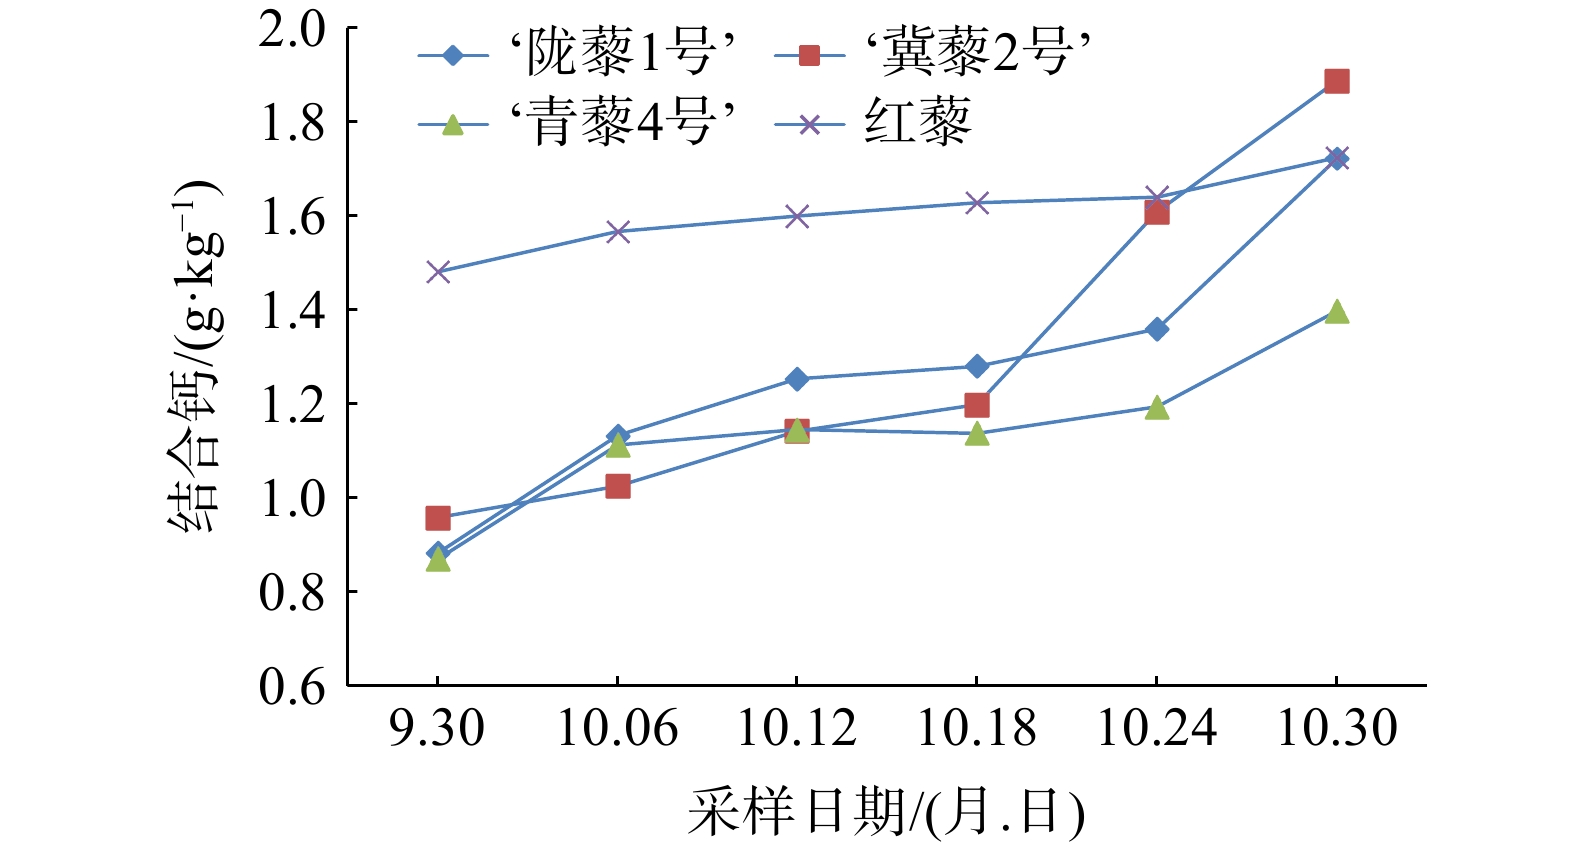
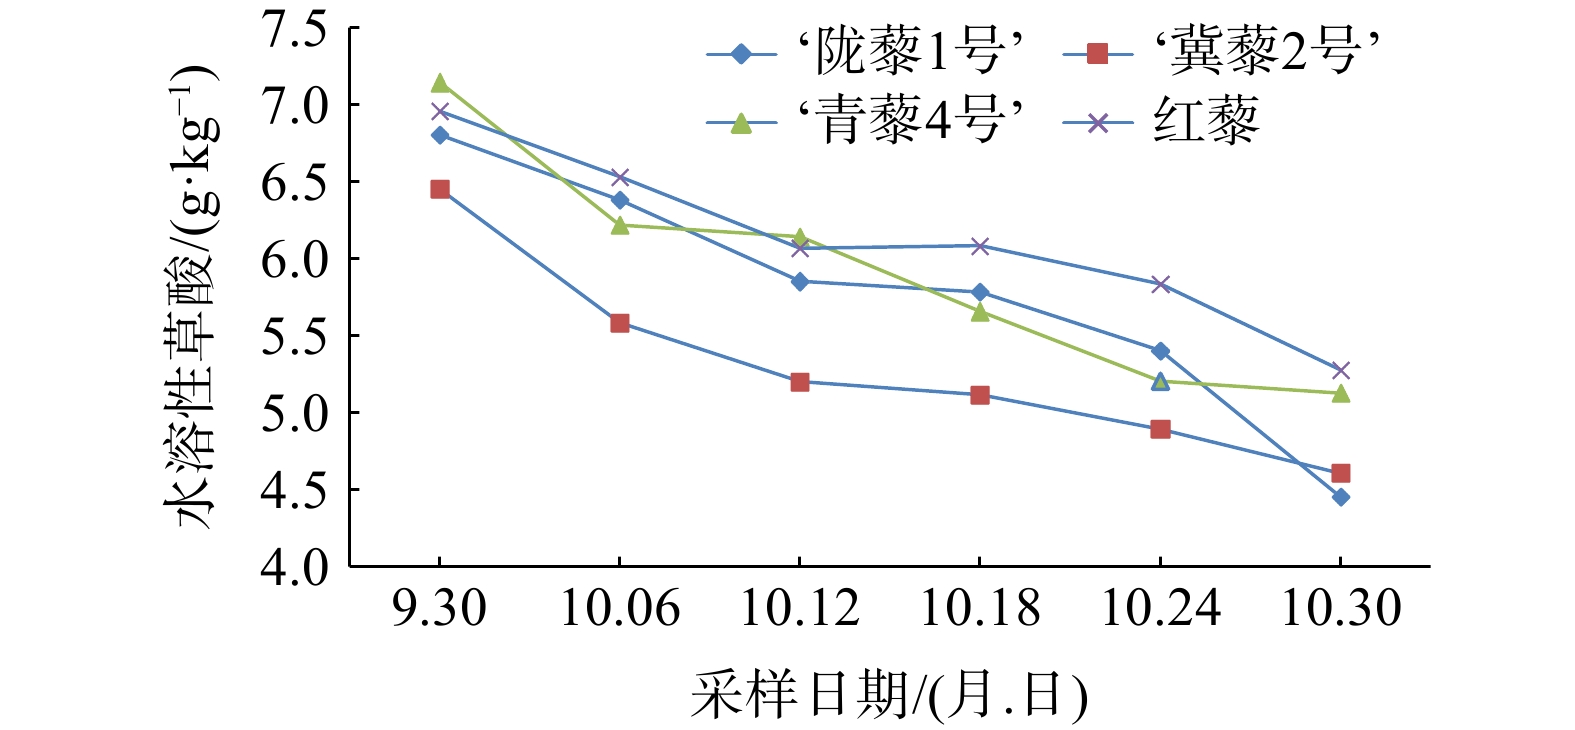
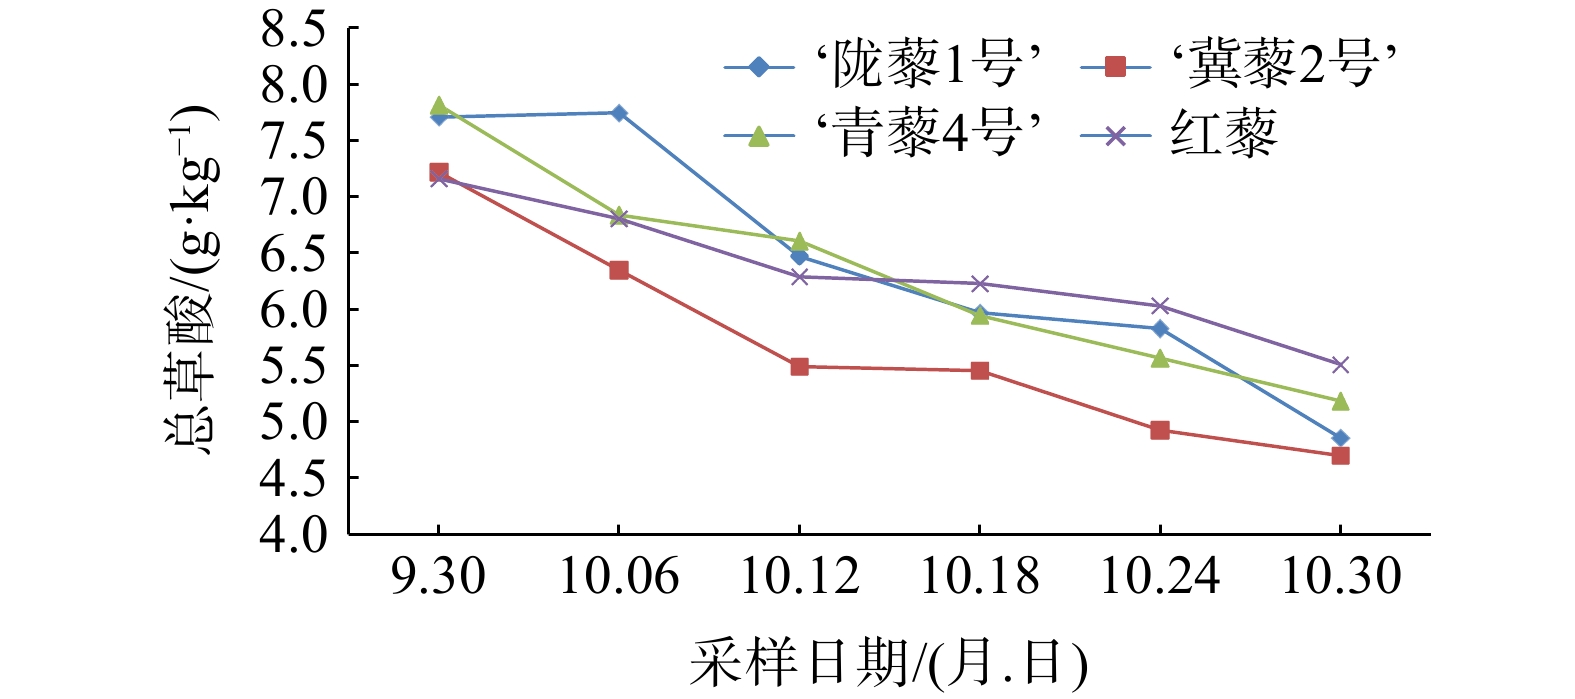
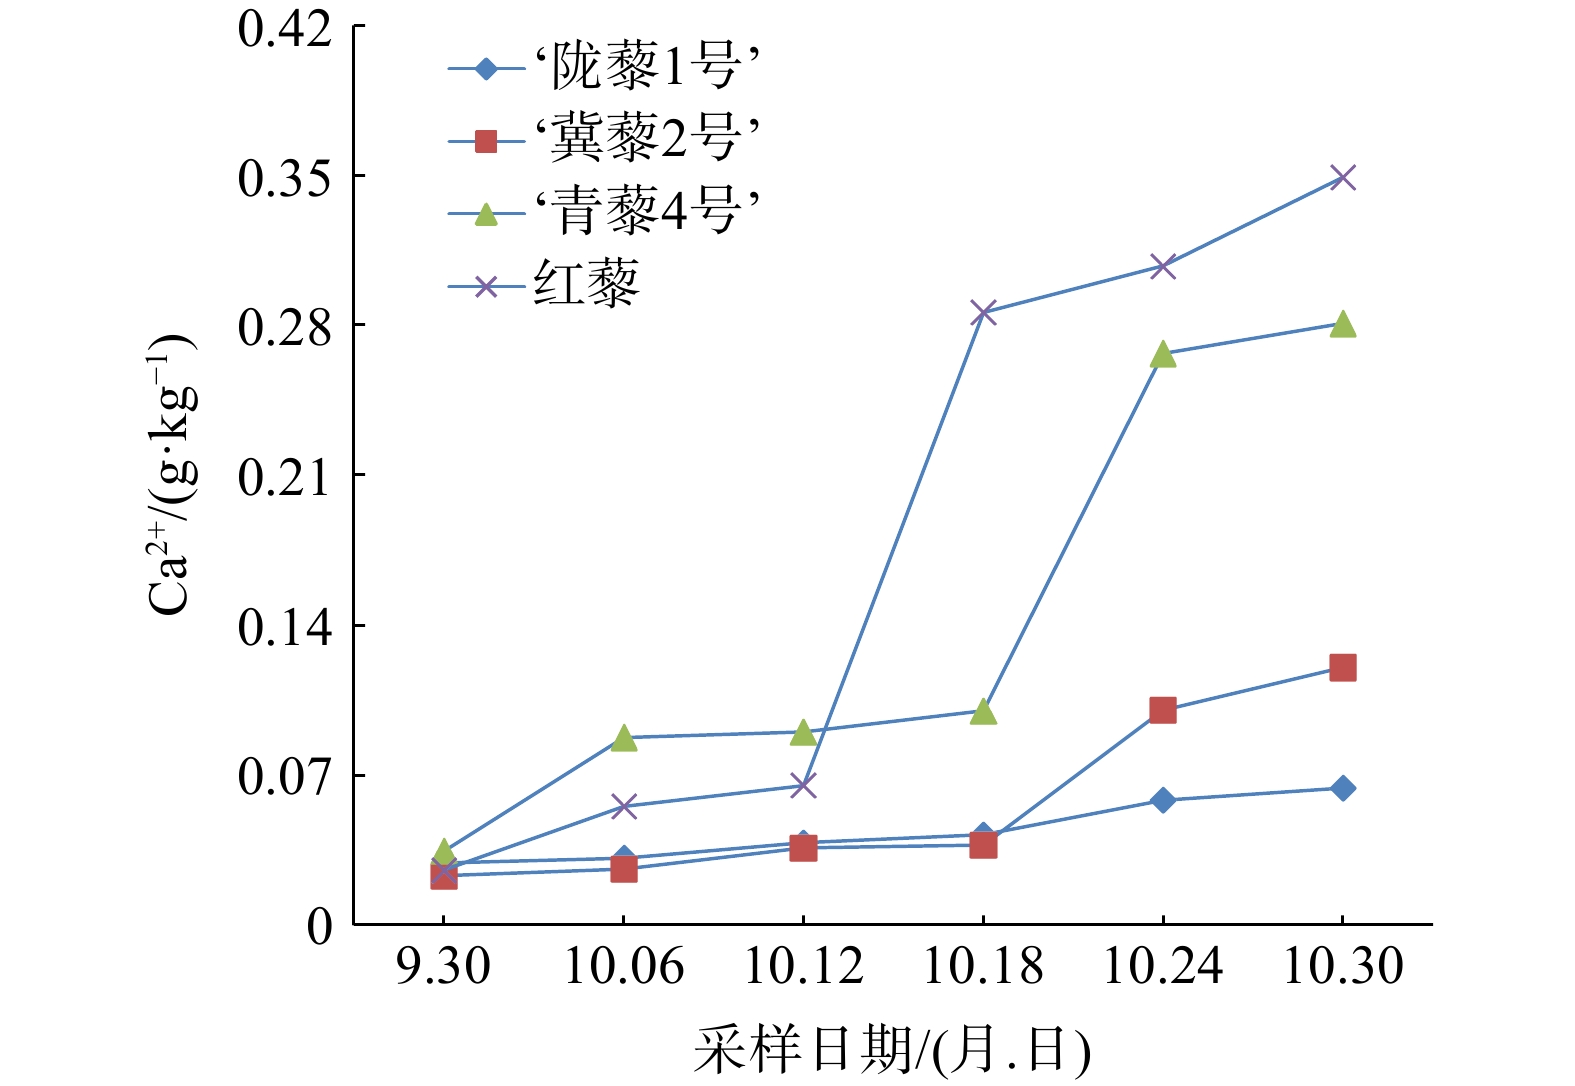
结果在藜麦叶片可食用期内,叶片中钙形态以结合钙为主,平均占比总钙含量的92%以上,其中以‘陇藜1号’叶片中的结合钙含量占比最高,达97.3%,而含量最高的是红藜叶片,达2.16 g·kg−1。结合钙含量在藜麦叶片可食用生长期内呈不断增加趋势,增量最高的是‘冀藜2号’,由0.958 g·kg−1增至1.887 g·kg−1,游离钙(Ca2+)含量也呈不断增加的趋势,前期增幅大,后期增量大,其中增量最大的是红藜,由0.026 g·kg−1增至0.349 g·kg−1。Ca2+平均含量仍以红藜最高,达0.182 g·kg−1。水溶性草酸是藜麦叶片中草酸的主要存在形式,平均含量为5.78 g·kg−1,占总草酸含量的93.4%。水溶性草酸含量均随着生长时间的增加而减少,其中减量最大的是‘陇藜1号’,始末采样(首次采样和第6次采样)间可溶性草酸含量减少2.35 g·kg−1,减幅最大的也是‘陇藜1号’,达35%。总草酸含量动态与水溶性草酸含量动态相似,生长期内含量仍呈不断下降趋势,其中减量和减幅最大的均是‘陇藜1号’。叶片可采食期内以固体形态存在的草酸平均含量以‘陇藜1号’最高,达0.65 g·kg−1,红藜叶片中含量最低。相关性分析表明,草酸含量和生长时间之间呈显著负相关(P<0.01),总钙含量与生长时间呈显著正相关(P<0.01),草酸含量与总钙含量呈显著负相关(P<0.01)。
结论从营养价值和口感的角度来看,中后期的藜麦叶片更适合食用。
Abstract:In order to find out the content of calcium and oxalic acid in the leaves of the genus Chenopodium, the main cultivated plant in Zhejiang Province, Ch. Quinoa ‘Longli 1’ Ch. Quinoa ‘Qingli 4’ Ch. Quinoa ‘Jili 2’ and Chenopodium formosanum were used as research objects and determined the content of calcium and oxalic acid in different forms within the edible period. The results showed that during the edible period of quinoa leaves, the bound calcium was mainly calcium, accounting for an average of more than 92% of the total calcium. Among them, Ch. Quinoa ‘Longli 1’ accounted for the most, reaching 97.3%, while the highest content was in Chenopodium formosanum, reaching 2.16 g·kg−1. The combined calcium content shows a continuous increasing trend, with the highest increase being in Ch. Quinoa ‘Jili 2’, which increased from 0.958 g·kg−1to 1.887g·kg−1. Ca2+ also showed continuous increasing trend, with a large increase in the early stage and a large increase in the later stage. The largest increment was Chenopodium formosanum, from 0.026 g·kg−1 to 0.349 g·kg−1. The average content of Ca2+ was still highest in Chenopodium formosanum, reaching 0.182 g·kg−1. Water soluble oxalic acid was the main form of oxalic acid present in quinoa leaves, with an average content of 5.78 g·kg−1, accounting for 93.4% of the total oxalic acid. Water soluble oxalic acid decreased within growth time, with the largest decrease being in Ch. Quinoa ‘Longli 1’. The soluble oxalic acid content decreased by 2.352 g·kg−1 between the beginning and end samples, and the largest decrease was Ch. Quinoa ‘Longli 1’, reaching 35%. The dynamic content of total oxalic acid was similar to water-soluble oxalic acid, and the content still showed a continuous decreasing trend during the growth period. Among them, the largest reduction and decline was Ch. Quinoa ‘Longli 1’. The average content of oxalic acid in solid form leaves is highest in Ch. Quinoa ‘Longli 1’, reaching 0.65 g·kg−1, while the content of Chenopodium formosanum leaves was the lowest. Correlation analysis showed that there was a significant negative correlation between oxalic acid content and growth time, significant positive correlation between total calcium content and growth time, and significant negative correlation between oxalic acid content and total calcium content.
-
Keywords:
- Chenopodium quinoa /
- Leaves /
- Calcium /
- Oxalic acid /
- Relativity
-
-
![]()
图 1 藜麦生长期叶片Ca2+含量动态
Figure 1. Dynamics of Ca2+ content in leaves of quinoa during growth period
![]()
图 2 藜麦生长期叶片结合钙含量动态
Figure 2. Dynamics of bound calcium content in leaves of quinoa during growth period
![]()
图 3 藜麦生长期叶片水溶性草酸含量动态
Figure 3. Dynamics of water soluble oxalic acid content in leaves of quinoa during growth period
![]()
图 4 藜麦生长期叶片总草酸含量动态
Figure 4. Dynamics of water soluble total oxalic acid content in leaves of quinoa during growth period
表 1 ICP/MS检测技术参数
Table 1 Technical parameters for ICP/MS detection
参数 条件 参数 条件 参数 条件 参数 条件 射频功率 1 450 W 氦气流量 4.2 L·min−1 采样深度 10 mm 采集检测 自动跳峰 等离子体气体流量 15 L·min−1 雾化室温度 2 ℃ 蠕动泵转速 0.3 r·s−1 重复次数 3次 载气流量 0.8 L·min−1 雾化器 高盐 测定点数 1个 分析模式 碰撞 辅助气流量 0.5 L·min−1  下载: 导出CSV
表 2 钙元素在藜麦叶片中各形态的含量
Table 2 Content of calcium elements in various forms in quinoa leaves
品种(种) 游离钙 结合钙 无机钙 有机钙 含量/(g·kg−1) 溶出比/% 含量/(g·kg−1) 溶出比/% 含量/(g·kg−1) 溶出比/% ‘陇藜1号’ 0.044 2.7 1.316 82.2 0.240 15.0 ‘冀藜2号’ 0.057 3.5 1.361 82.4 0.233 14.1 ‘青藜4号’ 0.143 8.5 1.286 76.6 0.249 14.8 红藜 0.182 7.8 1.788 76.4 0.371 15.9
下载: 导出CSV
表 3 青藜叶草酸与钙含量Pearson相关性分析
Table 3 Pearson correlation table between oxalic acid and calcium content in Quinoa ‘Qingli 4’ Ch leaves
生长时间 游离钙 无机钙 有机钙 总钙 可溶草酸 总草酸 生长时间 Pearson 相关 1 0.916 7* 0.758 7 0.350 1 0.950 6** −0.964 1** −0.984 1** P值 − 0.010 1 0.080 3 0.496 3 0.003 6 0.0019 0.000 4 游离钙 Pearson 相关 0.916 7* 1 0.546 0 0.6118 0.932 6** − 0.88789 *−0.885 0* P值 0.010 1 − 2.622 3 0.1968 0.006 7 0.0182 0.019 1 盐酸无机钙 Pearson 相关 0.758 7 0.5460 1 −0.193 2 0.783 5 − 0.7158 −0.760 0 P值 0.080 3 2.622 3 − 0.713 8 0.065 3 0.1102 0.079 5 硝酸有机钙 Pearson 相关 0.350 1 0.611 8 −0.193 2 1 0.4373 − 0.4356 −0.381 1 P值 0.496 3 0.196 8 0.713 8 − 0.3859 0.388 0 0.456 0 总钙 Pearson 相关 0.950 6** 0.932 6** 0.783 5 0.437 3 1 −0.939 2** −0.948 6** P值 0.0036 10.006 7 0.065 3 0.385 9 − 0.005 4 0.003 9 可溶性草酸 Pearson 相关 −0.964 1** −0.887 9* −0.715 8 −0.435 6 −0.939 2** 1 0.993 0** P值 0.001 9 0.018 2 0.110 2 0.388 0 0.005 4 − 0.000 1 总草酸 Pearson 相关 −0.984 1* −0.885 0* −0.760 0 −0.381 1 −0.948 6** 0.993 0* 1 P值 0.000 4 0.019 1 0.079 5 0.456 0 0.003 9 0.000 1 − 注:“*”表示在0.05水平下相关性显著,“**”表示在0.01水平下相关性显著。
下载: 导出CSV
-
[1] 殷秀霞,陈芹芹,刘海双,等. 钙信号在植物响应盐胁迫中的作用研究进展[J]. 分子植物育种,2023,21(3):850 − 857. [2] 叶盛,汪东风,丁凌志,等. 植物体内钙的存在形式研究进展(综述)[J]. 安徽农业大学学报,2000,27(4):417 − 421. doi: 10.3969/j.issn.1672-352X.2000.04.025 [3] 赵宇,蔡丽,陈忠敏. 茶叶中草酸的含量测定[J]. 食品与发酵科技,2016,52(5):59 − 62,67. [4] 李梦琦,何兴东,杨祥祥,等. 半干旱区两种草原类型植物体内草酸钙研究[J]. 草地学报,2018,26(6):1421 − 1427 . [5] 徐平宜,张嘉悦,何兴东. 过渡带近距离同地分布不同植物群落建群种叶片草酸钙特征[J]. 草地学报,2021,29(5):929 − 935. [6] 乙引,苏志孟,张习敏,等. 草酸钙在植物中的生物合成及其防御功能[J]. 贵州师范大学学报:自然科学版,2018,36(4):1 − 6. [7] CASSLAND P,SJODE A,WINESTRAND S,et al. Evaluation of oxalate decarboxylase and oxalate oxidase for industrial applications[J]. Applied Biochemistry and Biotechnology,2010,161(1/8):255 − 263.
[8] 曾芳,刘忠珍,许桂芝,等. 蔬菜中不同形态草酸的提取测定[J]. 食品科学,2009(16):216 − 219. doi: 10.3321/j.issn:1002-6630.2009.16.046 [9] 邓文聪,王妮,付治国,等. 微波消解-ICP-OES法测定藜麦中的微量元素[J]. 广州化工,2016,44(18):146 − 148. doi: 10.3969/j.issn.1001-9677.2016.18.049 [10] 吴应齐,姚理武,赵红波,等. 藜属植物叶片生长期有益矿质元素含量动态分析[J]. 浙江林业科技,2023,43(6):60 − 65. doi: 10.3969/j.issn.1001-3776.2023.06.008 [11] 陆敏佳,蒋玉蓉,陈国林,等. 藜麦叶片黄酮类物质的提取及基因型差异[J]. 浙江农林大学学报,2014,31(4):534 − 540. doi: 10.11833/j.issn.2095-0756.2014.04.007 [12] 申瑞玲,张文杰,董吉林,等. 藜麦的主要营养成分、矿物元素及植物化学物质含量测定[J]. 郑州轻工业学院学报(自然科学版),2015,30(5/6):17 − 21. [13] WEBER E J. The Inca’s ancient answer to food shortage[J]. Nature,1978,272(5653):486. doi: 10.1038/272486a0
[14] AHAMED N T,SINGHAL R S,KULKARNI P R,et al. Alesser-known grain,Chenopodium quinoa:review of the chemical composition of its edible parts[J]. Food and Nutrition Bulletin,1998,19(1):61 − 70. doi: 10.1177/156482659801900110
[15] 梅丽,韩立红,祝宁,等. 藜麦菜的设施栽培技术[J]. 浙江农业科学,2022,63(10):2286 − 2290. [16] 杨爱峥,李志磊,付强,等. CO2浓度倍增和土壤盐胁迫对藜麦生理特征及产量的影响[J]. 农业工程学报,2021,37(4):181 − 187. doi: 10.11975/j.issn.1002-6819.2021.4.022 [17] JACOBSEN S E. The worldwide potential for quinoa (Chenopodium quinoa Willd.)[J]. Food Reviews International,2003,19(1/2):167 − 177.
[18] 杜春婷,党斌,杨希娟,等. 不同加工方式对藜麦淀粉结构与功能特性的影响[J]. 中国粮油学报,2022,37(4):54 − 61. [19] 吴应齐,姚理武,吴丽芳,等. 不同品系藜麦苗菜农艺性状及营养品质评价[J]. 浙江林业科技,2021,41(4):56 − 61. doi: 10.3969/j.issn.1001-3776.2021.04.009 [20] 周孟琪. 益阳地区鲜食藜麦苗菜栽培技术[J]. 长江蔬菜,2021(17):36 − 37. [21] 郭萍,尹跃明,杨德胜,等. 洞庭湖区藜麦苗菜种植试验初探[J]. 湖南农业科学,2020(2):22 − 26. [22] 汤秀梅,李崇宗,尹家元,等. 蔬菜中钙铝元素存在形态分析[J]. 微量元素与健康研究,2001,18(4):49 − 50. [23] 李孟孟,陈文迪,陈雯新,等. 马齿苋中草酸钙晶体形态及积累特征[J]. 中国果菜,2021,41(3):30 − 33. [24] WILKINS K A,MATTHUS E,Swarbreck SWARBRECKS M,et al. Calcium-mediated abiotic stress signaling in roots[J]. Fronts in Plant Science,7:1296.
[25] 王文昌,乔飞,江雪飞,等. 盐胁迫下巴西蕉幼苗部分细胞膜系统Ca+-ATPase的活性变化[J].植物生理学报,2016,52(8):1199 − 1206. [26] 王云堂. 钙在植物营养中的作用分析[J]. 种子科技,2019,37(6):32 − 33. [27] 刘帆,周青云,张宝忠,等. 盐碱地滴灌玉米体内Na+、K+、Ca2+、Mg2+的分布及运移特征[J]. 节水灌溉,2019(5):77 − 82. [28] 符云鹏,李国芸,王义伟,等. 短期水分胁迫对香料烟叶片含水量及渗透调节物质的影响[J]. 中国烟草学报,2008,14(6):41 − 43. [29] 张英鹏,林咸永,章永松,等. 氮素形态对菠菜硝酸盐及草酸含量的影响[J]. 园艺学报,2005,32(4):648 − 652.
计量
- 文章访问数: 30
- HTML全文浏览量: 8
- PDF下载量: 9
