
The Spatiotemporal Pattern and Driving Factors of Vegetation in Zhejiang Province over the Past 20 Years
-
摘要:
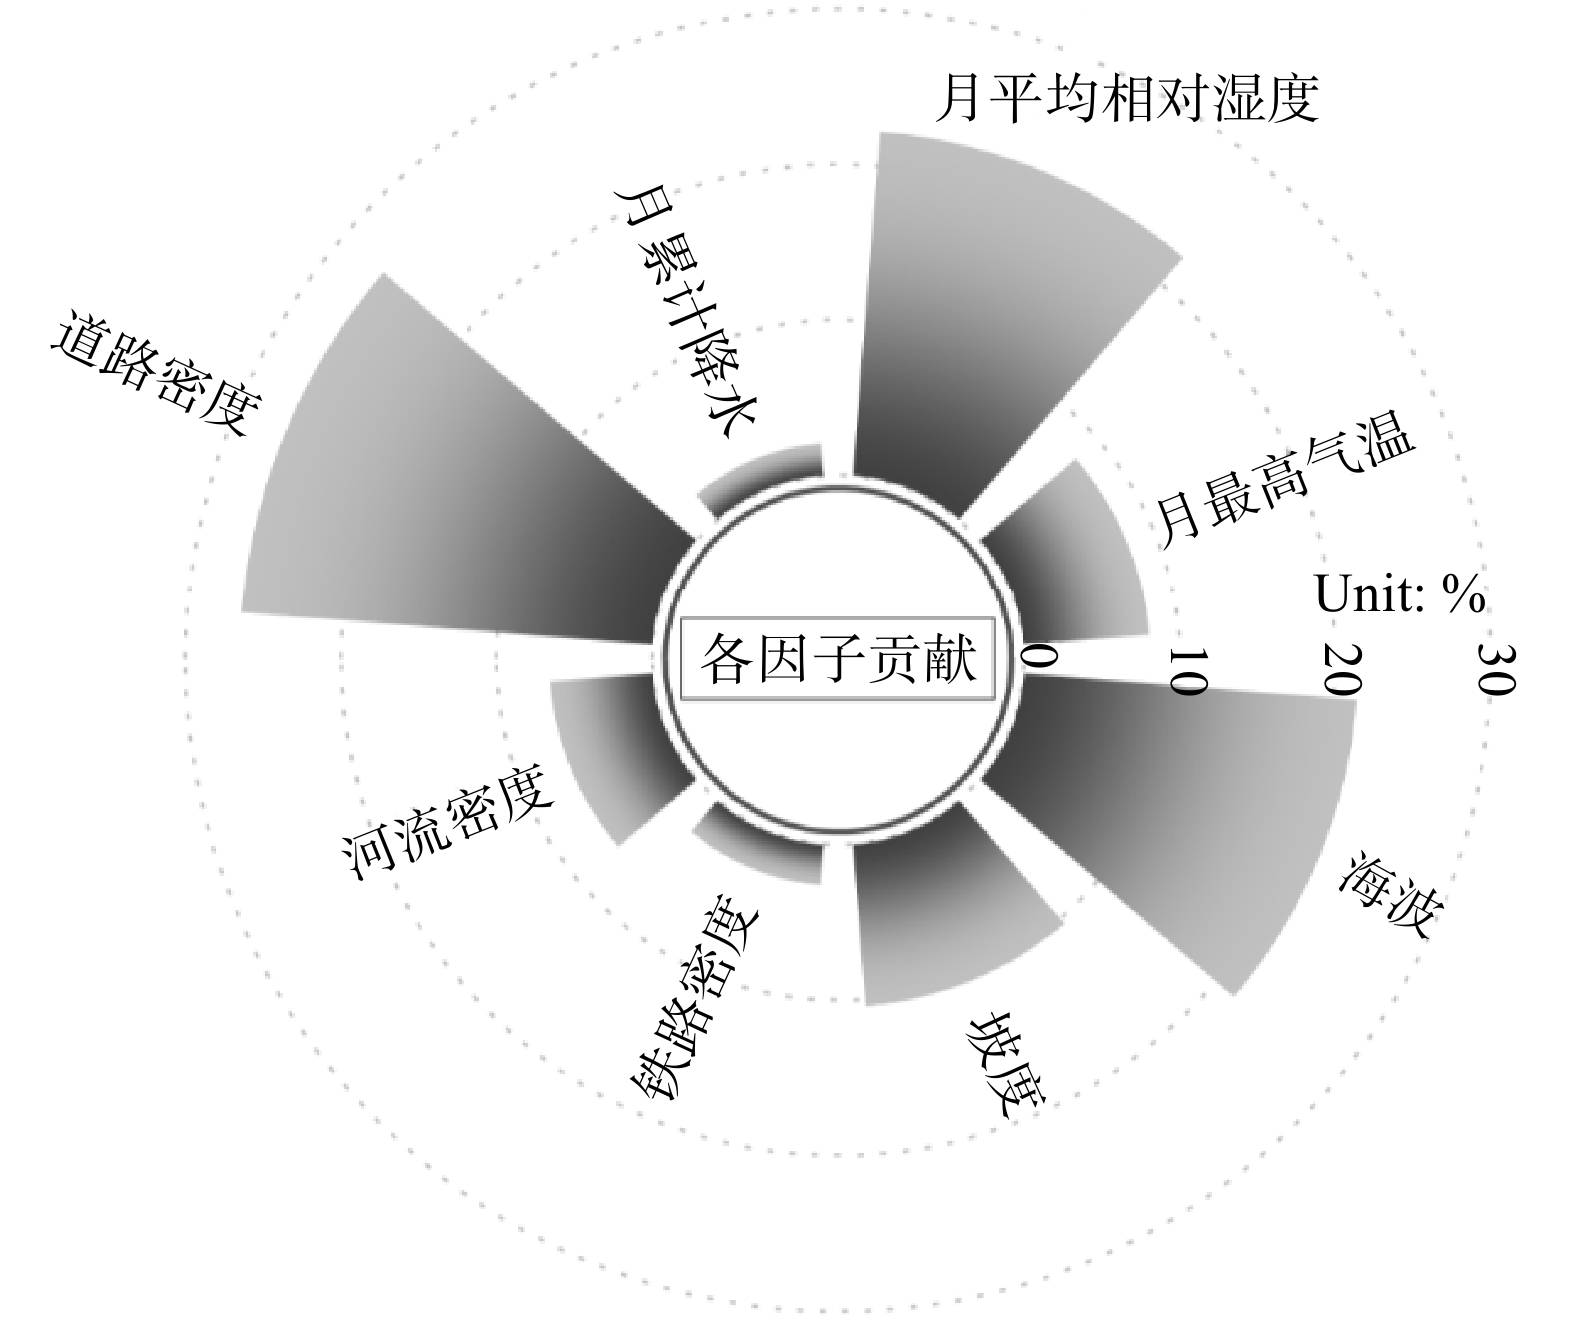
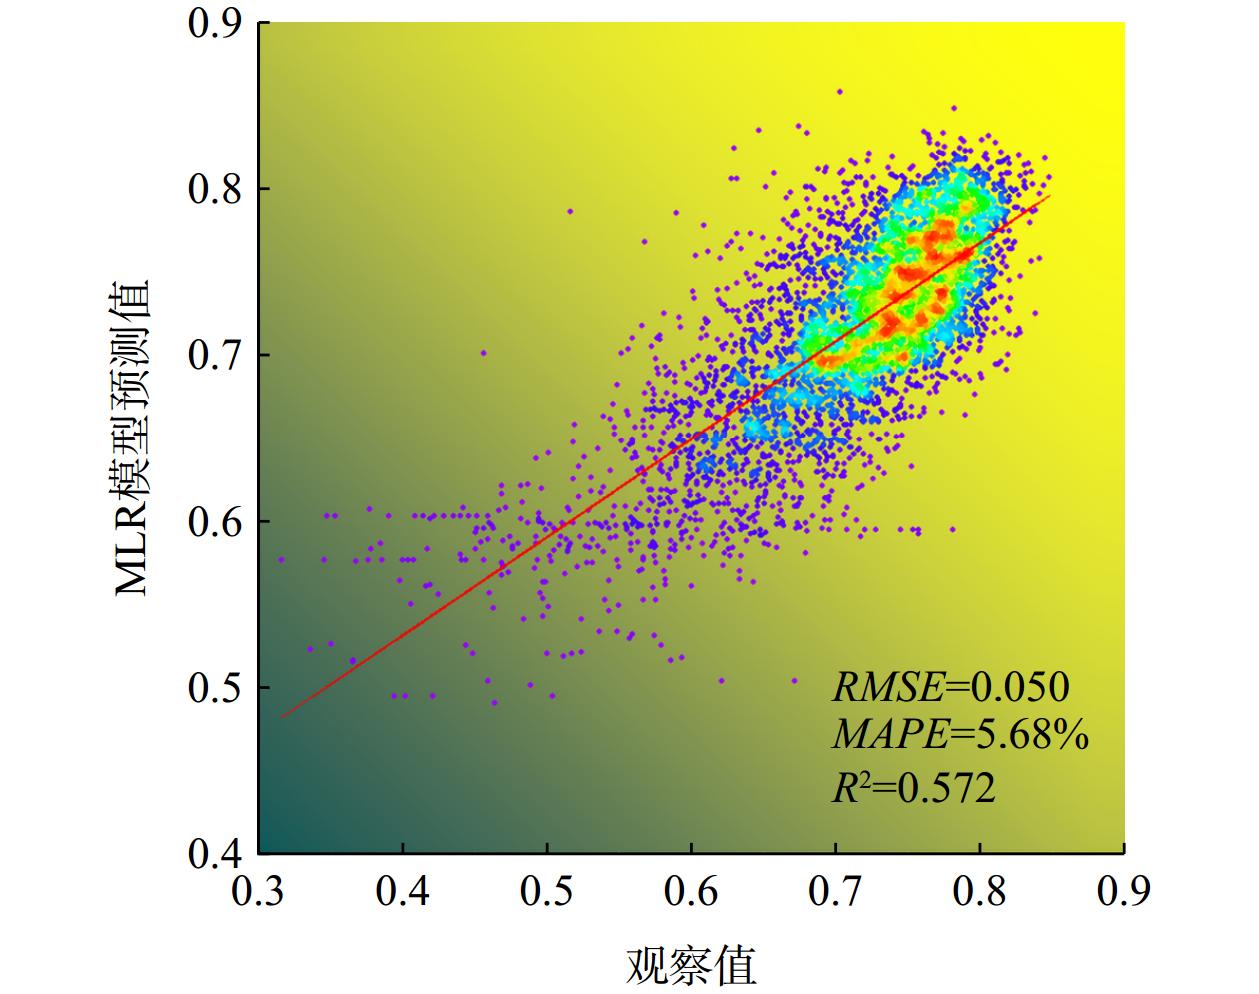
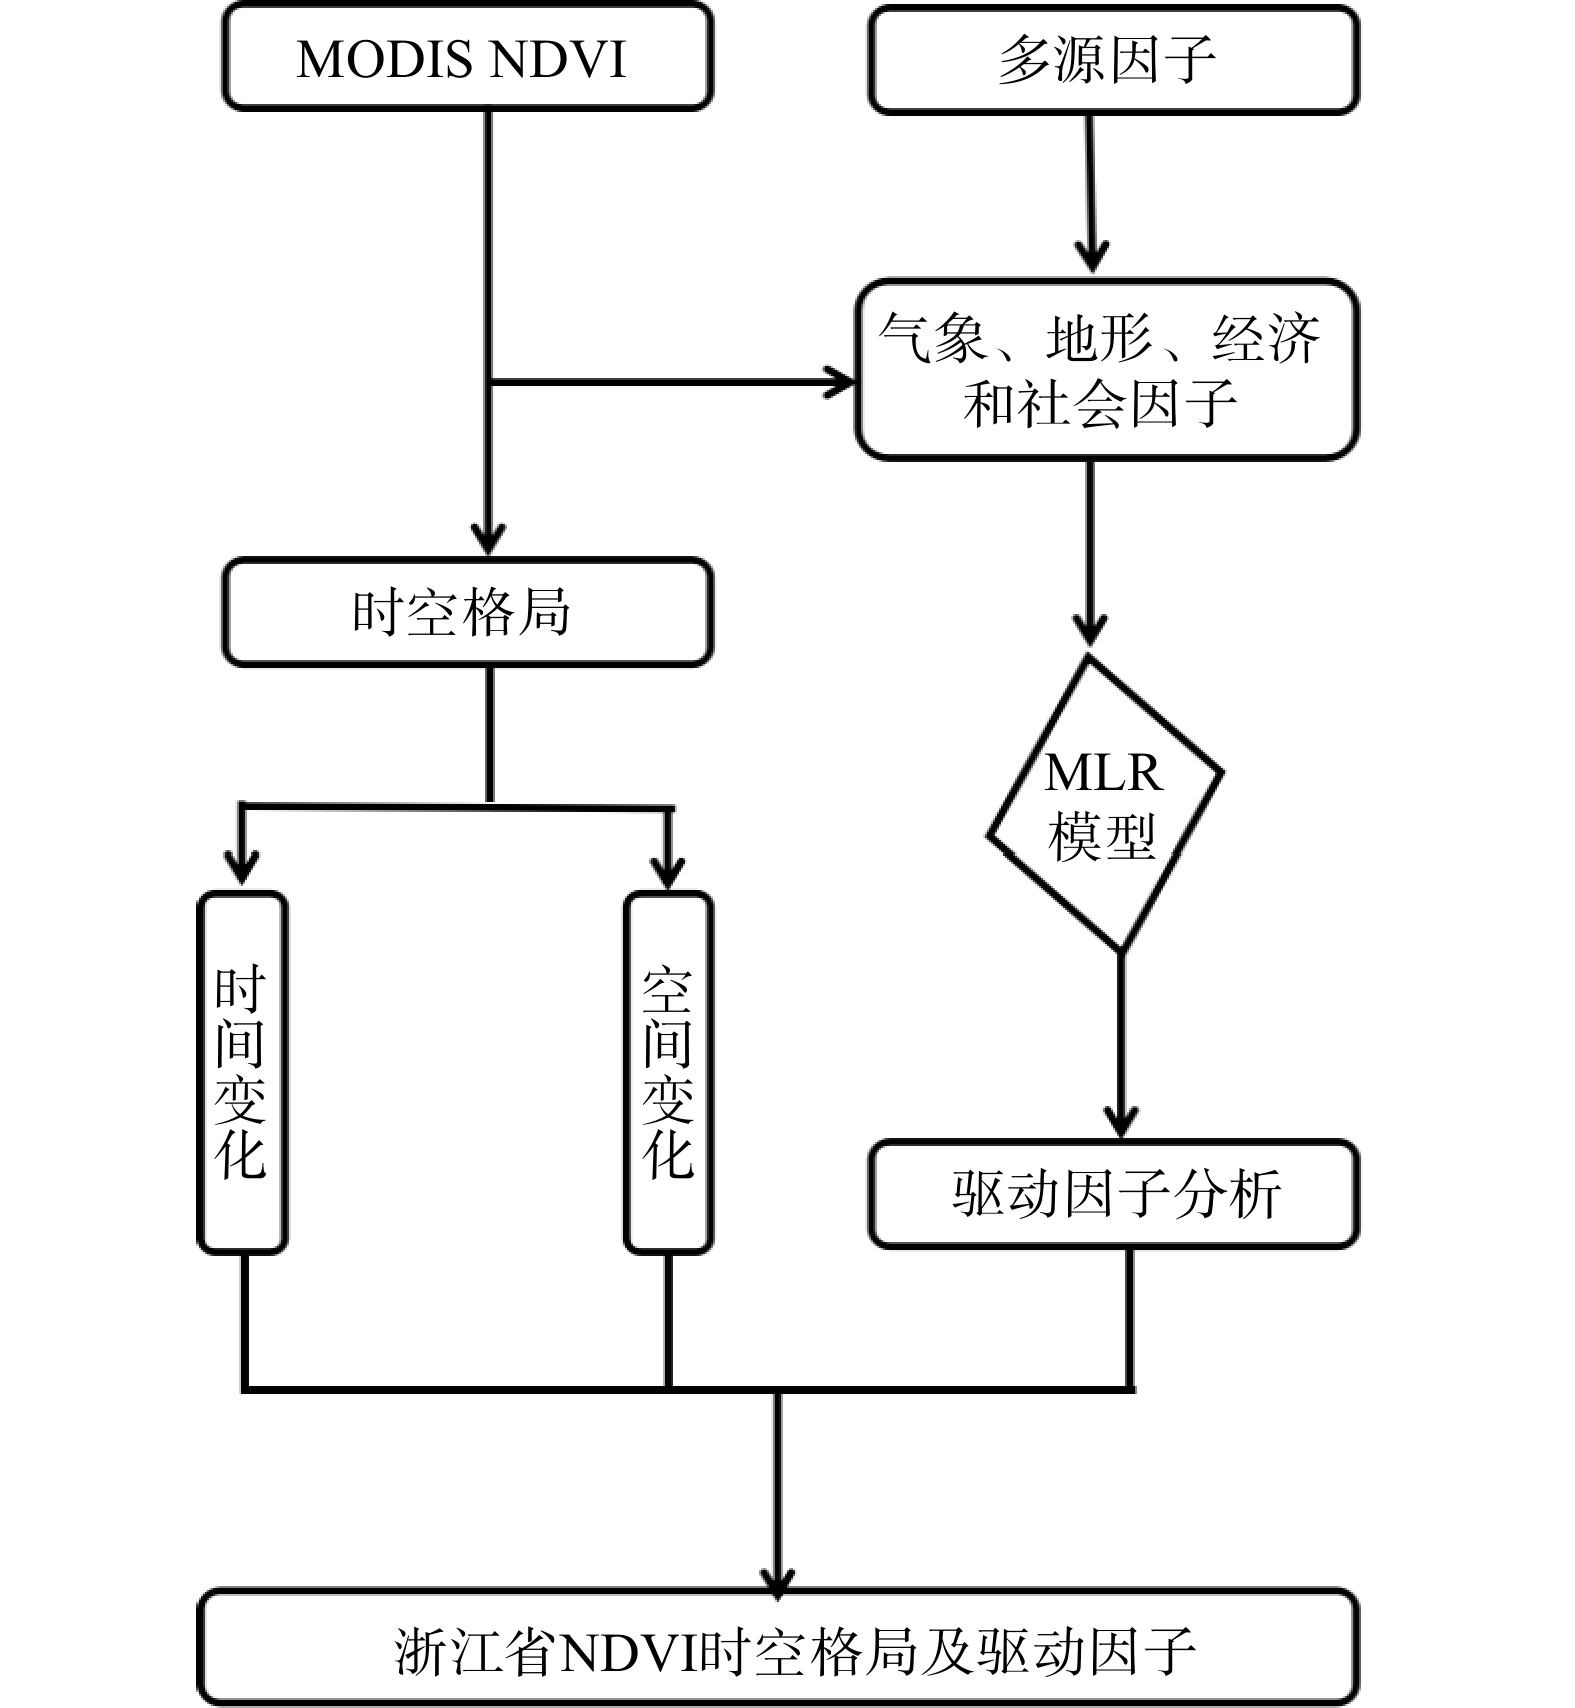
利用中分辨率MOD13Q1影像计算归一化植被指数(NDVI),应用地理信息系统技术提取了浙江省2000—2019年的NDVI数据,并运用趋势分析法对NDVI的时空格局、变化趋势及其驱动因子进行了研究。结果表明,2000—2019年浙江省NDVI在空间上存在显著差异,时间上呈波动上升趋势,平均增长率为0.022/10年。季节上,平均NDVI大小顺序为夏季 > 秋季 > 春季 > 冬季,呈现单峰单谷分布,峰值和谷值分别出现在7月和2月。总体来看,NDVI有所提高,改善和显著改善面积分别占全省总面积的15.81%和55.85%,退化面积占22.02%。多元线性回归模型结果显示,月最高气温、月平均相对湿度、月累计降水量、道路密度、河流密度、铁路密度、坡度和海拔等8个因子对NDVI有显著影响。模型的均方根误差(RMSE)、均方绝对百分比误差(MAPE)和变异解释量(R2)分别为0.050、5.68%和0.572,这表明多元线性回归模型在估测浙江省NDVI方面具有一定的可靠性。研究结果揭示了浙江省NDVI的时空格局及其驱动因子,为浙江省植被恢复提供了科学依据。
Abstract:This study utilized medium-resolution MOD13Q1 imagery to calculate the Normalized Difference Vegetation Index (NDVI). Using geographic information system (GIS) technology, NDVI data for Zhejiang Province from 2000 to 2019 was extracted. Trend analysis was then employed to investigate the spatiotemporal patterns, changing trends, and driving factors of NDVI in Zhejiang Province. The results show significant spatial differences in NDVI across Zhejiang Province from 2000 to 2019, with a fluctuating upward trend over time and an average growth rate of 0.022 per decade. Seasonally, the average NDVI ranked as follows: summer > autumn > spring > winter, exhibiting a single peak and single valley distribution, with the peak in July and the valley in February. Overall, NDVI improved with areas of improvement and significant improvement accounting for 15.81% and 55.85% of the province's total area, respectively, while degraded areas accounted for 22.02%. Results from a multiple linear regression model indicate that eight factors significantly influence NDVI: monthly maximum temperature, monthly average relative humidity, monthly cumulative precipitation, road density, river density, railway density, slope, and altitude. The model’s root mean square error (RMSE), mean absolute percentage error (MAPE), and coefficient of determination (R2) were 0.050, 5.68%, and 0.572, respectively, indicating a certain level of reliability in estimating NDVI in Zhejiang Province. The study's findings reveal the spatiotemporal patterns and driving factors of NDVI in Zhejiang Province, providing a scientific basis for vegetation restoration in the region.
-
Keywords:
- Zhejiang /
- NDVI /
- Spatial and temporal patterns /
- trend analysis /
- driving factors
-
-
![]()
图 2 2000—2019年浙江省平均NDVI月变化
Figure 2. Monthly variation of average NDVI in Zhejiang Province from 2000 to 2019
![]()
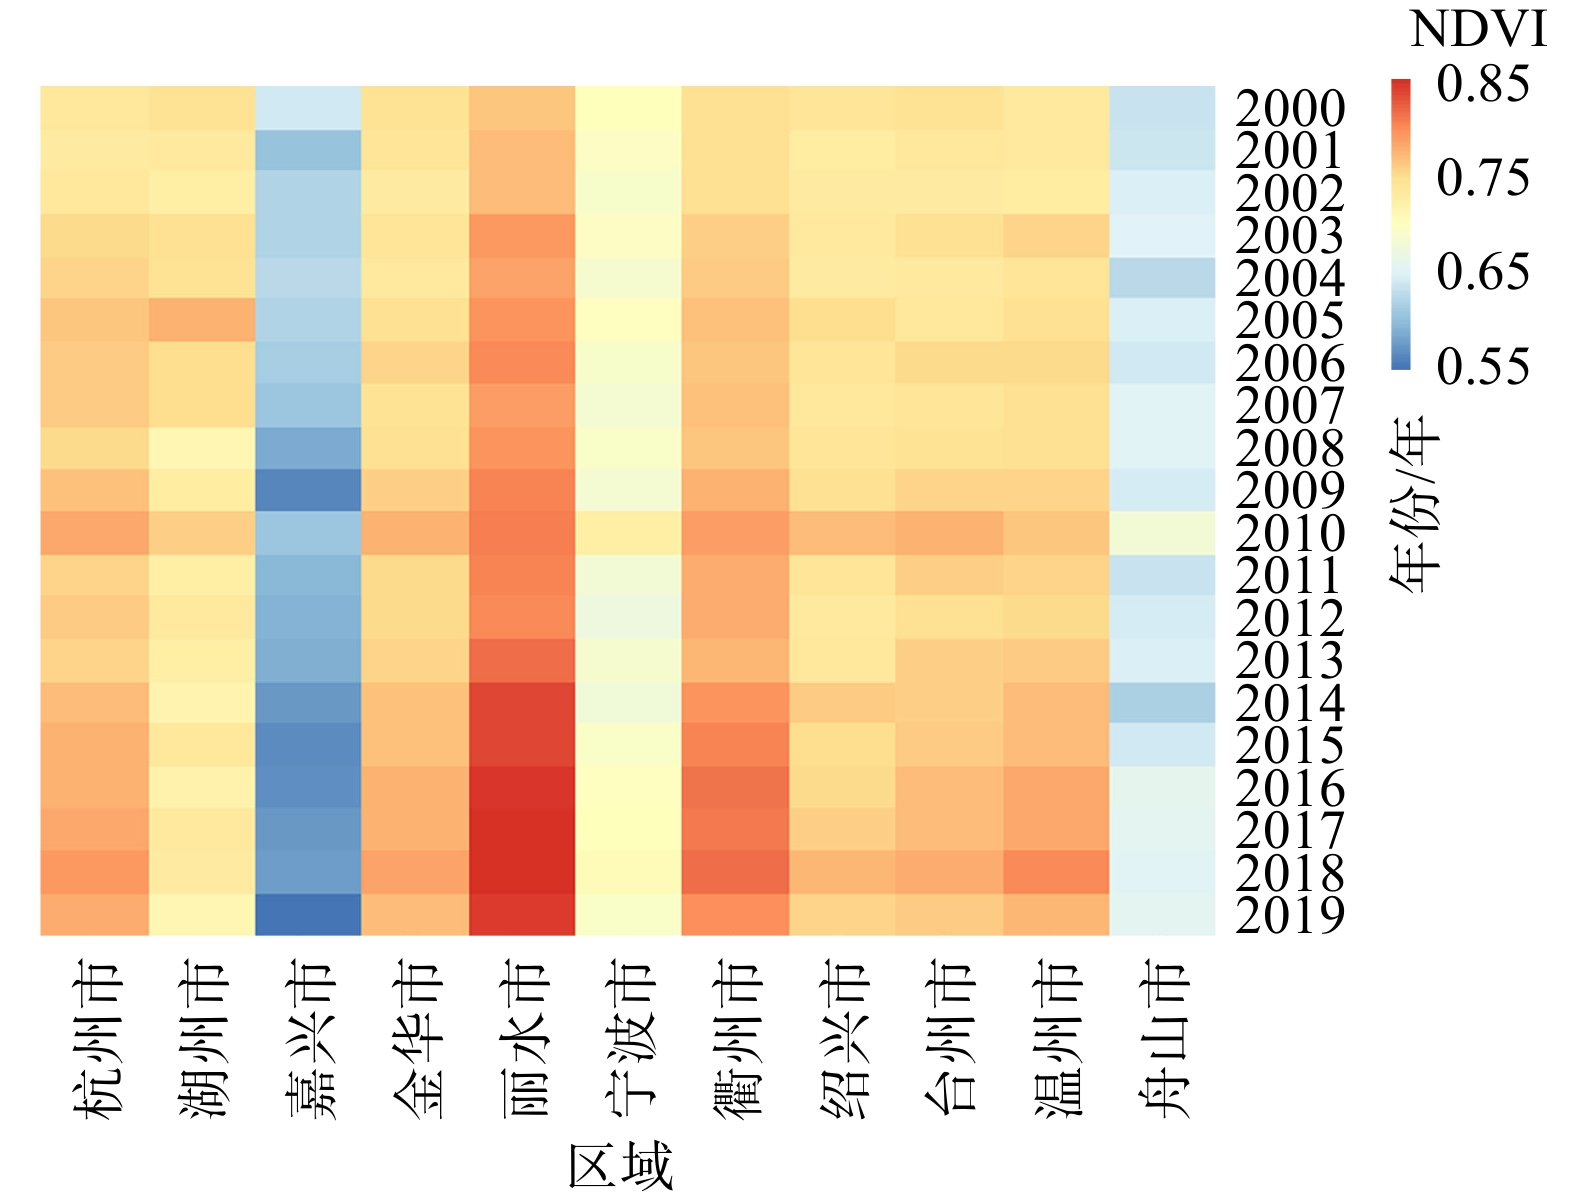
图 3 2000—2019年浙江省平均NDVI年变化
Figure 3. Annual variation of average NDVI in Zhejiang Province from 2000 to 2019
![]()
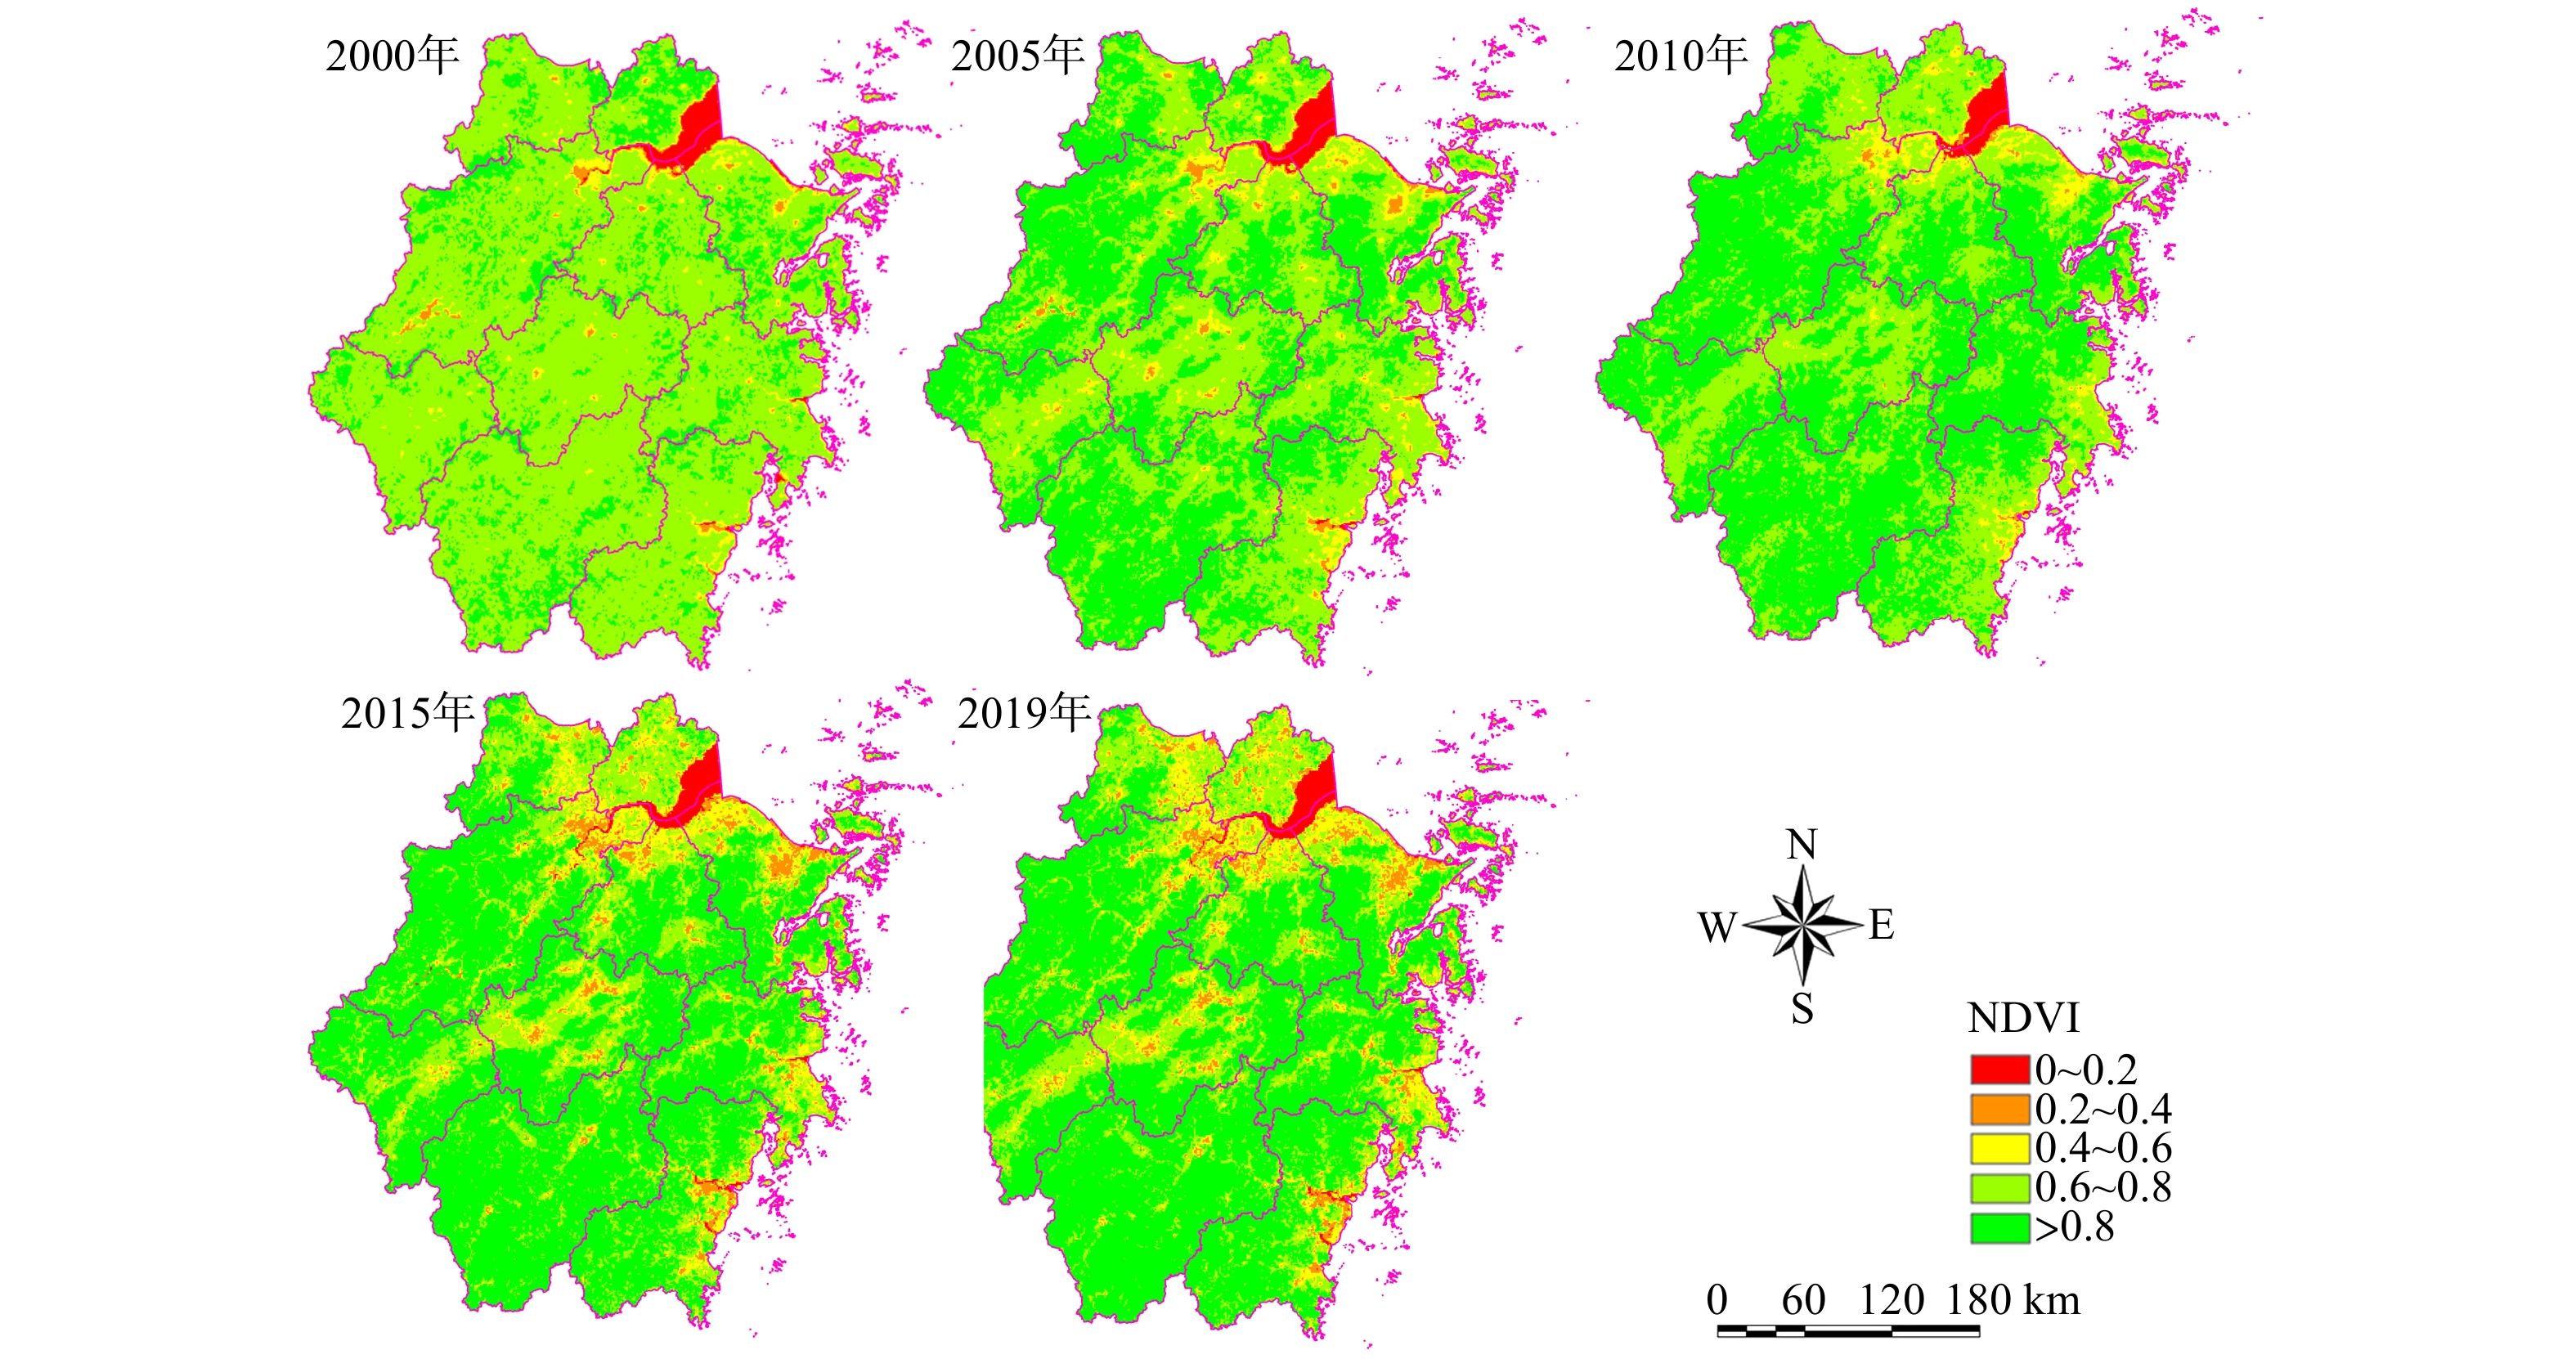
图 5 2000—2019年浙江省NDVI时空变化
Figure 5. Spatial changes of NDVI in Zhejiang from 2000 to 2019
![]()
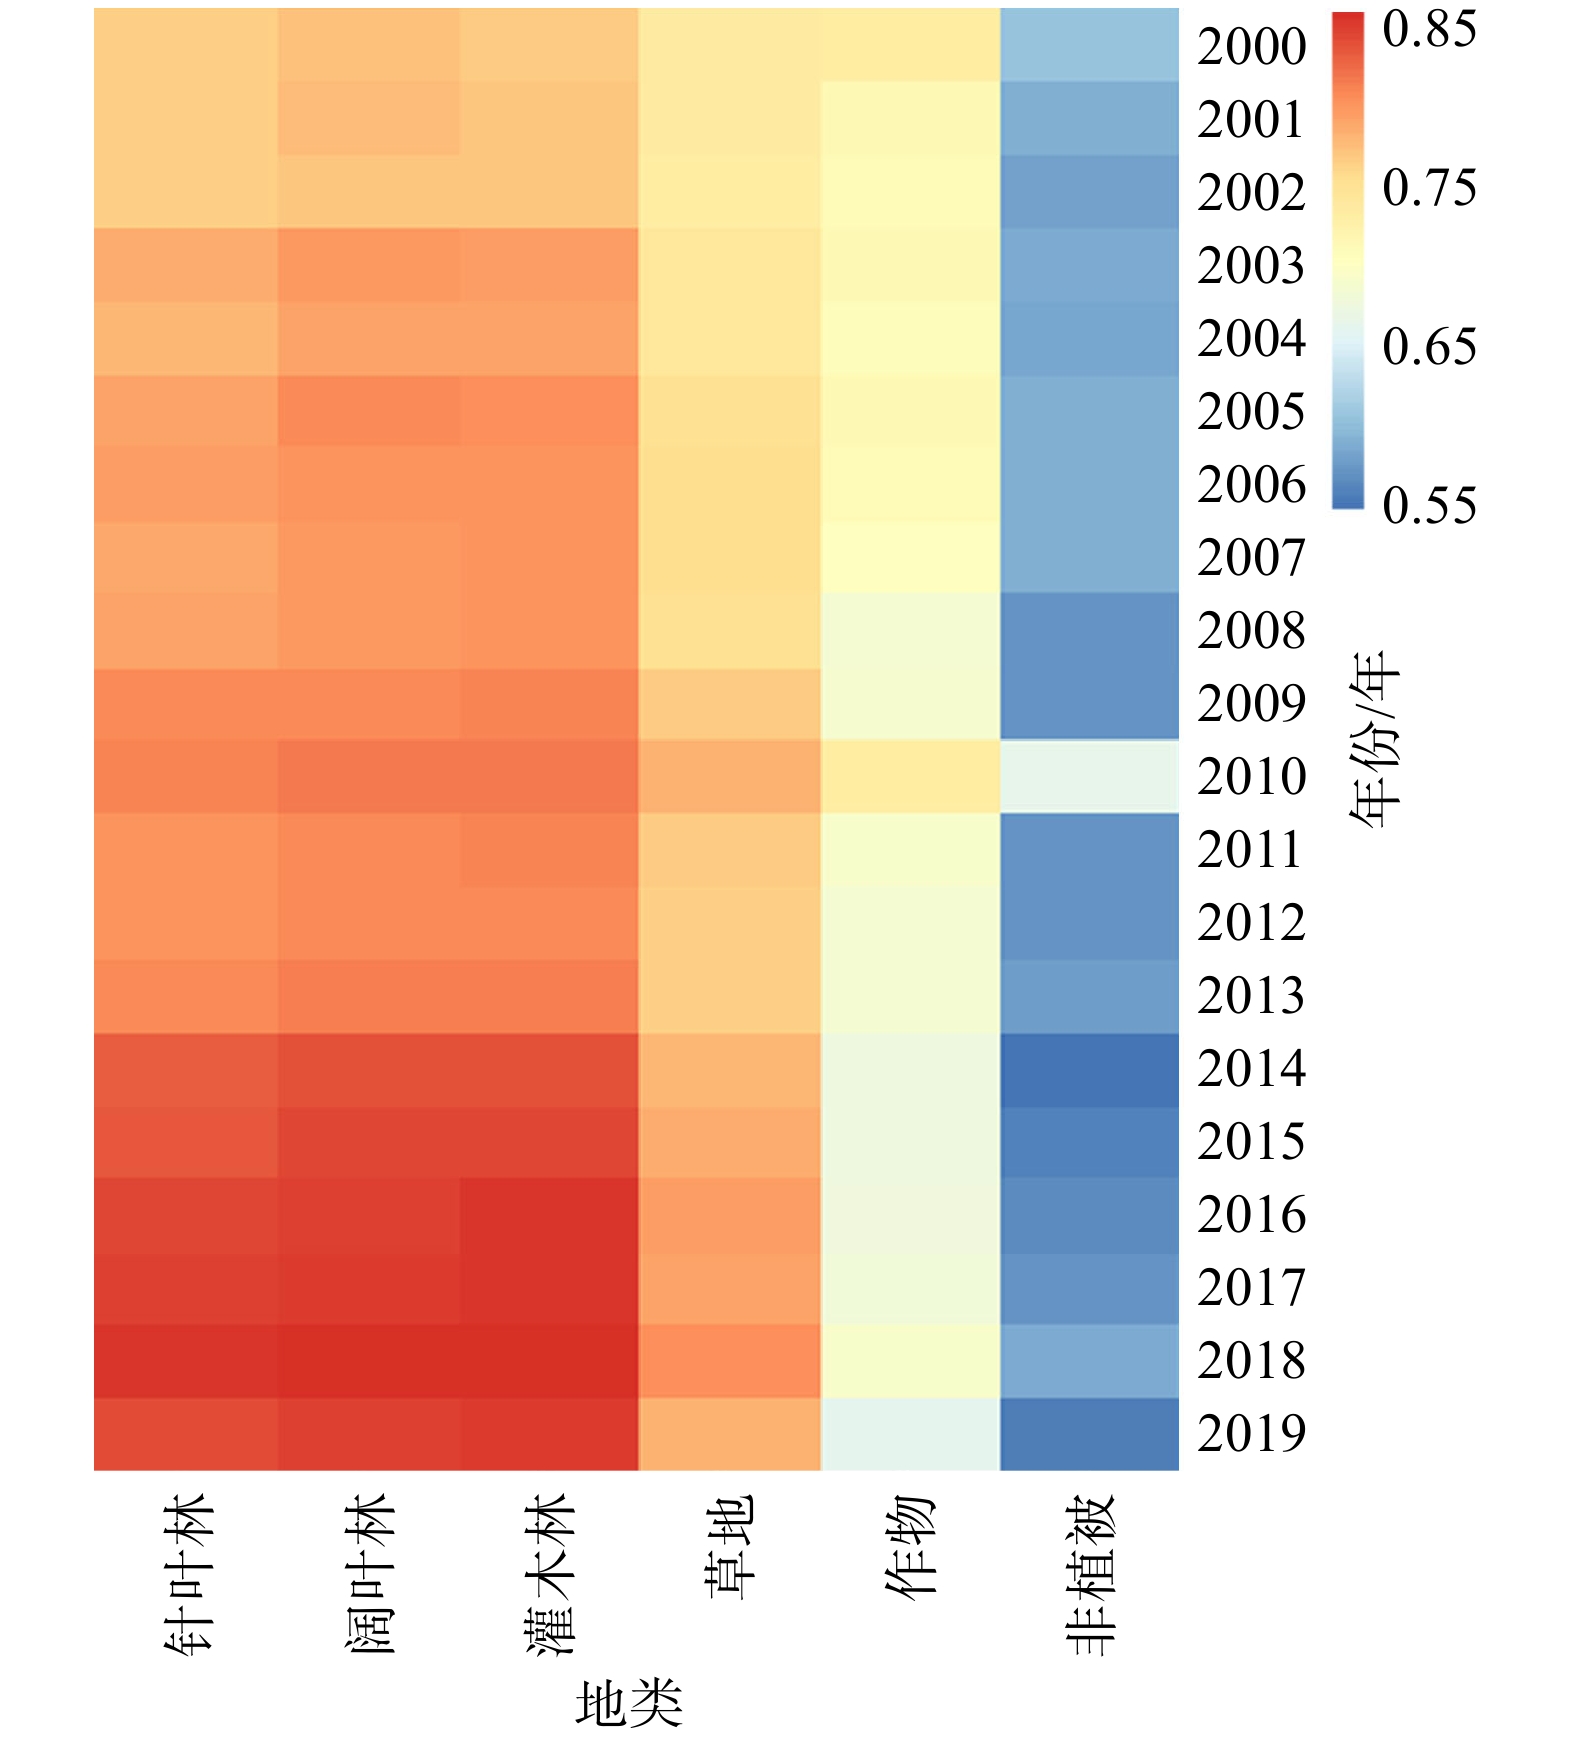
图 8 浙江省不同地类的NDVI年变化
Figure 8. Annual changes of NDVI in different land types in Zhejiang Province
![]()
图 10 多元线性回归模型观测值和预测值线性拟合图
Figure 10. Plots of the observed and the predicted values calculated by MLR model for the final model
表 1 多元线性回归模型因子筛选
Table 1 Factor screening for multiple linear regression models
模型变量 P值最小值 P值最大值 样本显著性数 VIF 解释度/% 月日照时数 0.036 0.396 1 21.76 2.41 月平均气温 0.264 0.871 0 13.3 3.35 月最高气温 <0.001 <0.001 5 4.93 6.85 月最低气温 0.047 0.845 1 9.28 9.37 月平均相对湿 <0.001 <0.001 5 2.1 10.2 月最小相对湿 0.639 0.949 0 8.36 0.13 月极大风速 0.581 0.945 1 8.36 0.23 月累计降水 <0.001 0.125 4 1.24 1.45 居民点密度 0.521 0.740 0 1.4 2.94 POI点密度 0.058 0.574 0 1.84 9.19 道路密度 <0.001 <0.001 5 3.1 22.39 河流密度 <0.001 <0.001 5 3.46 5.42 铁路密度 <0.001 0.212 4 1.91 1.87 人口密度 0.045 0.946 1 1.77 0.99 GDP 0.194 0.762 0 1.74 0.82 坡向 0.676 0.925 0 1.11 0.63 坡度 <0.001 0.078 4 1.66 7.87 海拔 <0.001 0.002 5 2 13.88  下载: 导出CSV
表 2 最终多元线性回归模型
Table 2 The final Multiple Linear Regression models
变量 估计系数 标准误 显著性水平 常量 0.623 40 0.013 23 / 月最高气温 0.000 18 0.000 04 <0.000 1 月平均相对湿 −0.001 20 0.000 11 <0.000 1 月累计降水 0.000 05 0.000 01 0.041 2 道路密度 −2.745 00 0.250 10 <0.000 1 河流密度 −2.088 00 0.472 50 <0.000 1 铁路密度 −0.372 80 0.451 20 0.040 9 坡度 0.003 51 0.001 75 0.045 1 海拔 0.000 07 0.000 01 <0.000 1
下载: 导出CSV
-
[1] FU B,WANG S,LIU Y,et al. Hydrogeomorphic ecosystem responses to natural and anthropogenic changes in the loess plateau of China[J]. Annual Review of Earth & Planetary Sciences,2016,45(1):223 − 243.
[2] MING C,GRIFFIS T J,BAKER J,et al. Simulating crop phenology in the Community Land Model and its impact on energy and carbon fluxes[J]. Journal of Geophysical Research:Biogeosciences,2015,120(2):310 − 325.
[3] LIU Z,LIU Y,LI Y. Anthropogenic contributions dominate trends of vegetation cover change over the farming-pastoral ecotone of northern China[J]. Ecological Indicators,2018,95:370 − 378. doi: 10.1016/j.ecolind.2018.07.063
[4] WANG K,ZHANG C,CHEN H,et al. Karst landscapes of China:patterns,ecosystem processes and services[J]. Landscape Ecology,2019,34(3):2743 − 2763.
[5] QIAO Y,CHEN H,JIANG Y. Quantifying the impacts of lithology on vegetation restoration using a random forest model in a karst trough valley,China[J]. Ecological Engineering,2020,156:1059 − 1073.
[6] JIANG Z,LIAN Y,QIN X. Rocky desertification in Southwest China:Impacts,causes,and restoration[J]. Earthence Reviews,2014,132(3):1 − 12.
[7] GAMS I,GABROVEC M. Land use and human impact in the Dinaric karst[J]. International Journal of Speleology,1999,28(1): 55 − 70.
[8] PENG T,DENG H. Research on the sustainable development process of low-carbon pilot cities:the case study of Guiyang,a low-carbon pilot city in south-west China[J]. Environment,Development and Sustainability,2021,23(2):2382 − 2403.
[9] ZHANG M,ZHANG H,LI X,et al. Classification of Paddy Rice Using a Stacked Generalization Approach and the Spectral Mixture Method Based on MODIS Time Series[J]. IEEE Journal of Selected Topics in Applied Earth Observations and Remote Sensing,2020,13:2264 − 2275. doi: 10.1109/JSTARS.2020.2994335
[10] CHEN B,CHEN L,BO H,et al. Dynamic monitoring of the Poyang Lake wetland by integrating Landsat and MODIS observations[J]. ISPRS Journal of Photogrammetry and Remote Sensing,2018,139:75 − 87. doi: 10.1016/j.isprsjprs.2018.02.021
[11] ZHU Z,WOODCOCK CE, OLOFSSON P. Continuous monitoring of forest disturbance using all available Landsat imagery[J]. Remote Sensing of Environment,2012,122:75 − 91.
[12] LIU L,WANG Y,WANG Z,et al. Elevation-dependent decline in vegetation greening rate driven by increasing dryness based on three satellite NDVI datasets on the Tibetan Plateau[J]. Ecological Indicators,2019,12(107):569 – 581.
[13] 刘宪锋,潘耀忠,朱秀芳,等. 2000-2014年秦巴山区植被覆盖时空变化特征及其归因[J]. 地理学报,2015,70(5):705 − 716. doi: 10.11821/dlxb201505003 [14] DU J,QUAN Z,FANG S,et al. Spatiotemporal changes in vegetation coverage and its causes in China since the Chinese economic reform[J]. Environmental Science and Pollution Research,2020,12(09):1144 – 1159.
[15] ZHANG M,LIN H,X LONG,et al. Analyzing the spatiotemporal pattern and driving factors of wetland vegetation changes using 2000–2019 time-series Landsat data[J]. Science of The Total Environment,2021,780(6):146615. doi: 10.1016/j.scitotenv.2021.146615.
[16] 刘泽晖,毕华兴,侯贵荣. 黄土残塬沟壑区范围界定及近21年来NDVI时空变化特征[J]. 水土保持学报,2021,35(6):144 − 150. [17] 何豫川,熊俊楠,阿布都马南·阿合买提哈力,等. 基于Google Earth Engine的阿勒泰地区植被时空格局及驱动力分析(英文)[J]. Journal of Resources and Ecology,2021,12(06):729 − 742. [18] 杨泽康,田佳,李万源,等. 黄河流域生态环境质量时空格局与演变趋势[J]. 生态学报,2021,41(19):7627 − 7636. [19] 朱丽亚. 辽河流域植被NDVI及NPP时空动态变化研究[D]. 北京:中国地质大学,2021. [20] 董晓雪. 黄河上游植被长期格局变化、成因及其对水文过程的影响[D]. 兰州:兰州大学,2021. [21] 张新悦,冯禹昊,曾辉,等. 1982—2014年华北及周边地区生长季NDVI变化及其与气候的关系[J]. 北京大学学报(自然科学版),2021,57(01):153 − 161. [22] 赵明伟,王妮,施慧慧,等. 2001—2015年间我国陆地植被覆盖度时空变化及驱动力分析[J]. 干旱区地理,2019,42(02):324 − 331. [23] YU H, L Y . Insights on the roles of climate and human activities to vegetation degradation and restoration in Beijing-Tianjin sandstorm source region[J/OL]. Ecological engineering:The Journal of Ecotechnology,2021,159(1):106105 − 106111.
[24] SUN L,ZHAO D,ZHANG G. Using SPOT VEGETATION for analyzing dynamic changes and influencing factors on vegetation restoration in the Three-River Headwaters Region in the last 20 years (2000—2019),China[J]. Ecological engineering:The Journal of Ecotechnology,2022,183(1):742 − 750.
[25] LI X,W Q. Exploring suitable topographical factor conditions for vegetation growth in Wanhuigou catchment on the Loess Plateau,China:A new perspective for ecological protection and restoration[J]. Ecological engineering:The Journal of Ecotechnology,2020,158(1):106 − 111.
[26] YUAN X,CUI WW,MENG J,et al. Vegetation changes and land surface feedbacks drive shifts in local temperatures over Central Asia[J]. Scientific Reports,12(7(1)):328 − 337.
[27] LI Q,SHI X,ZHAO Z. Ecological restoration in the source region of Lancang River:based on the relationship of plant diversity,stability and environmental factors[J]. Ecological engineering:The Journal of Ecotechnology,2022(180):2 − 13
[28] YAN D,YUAN Z,YANG Z,et al. Spatial and temporal changes in drought since 1961 in Haihe River basin[J]. Advances in Water Science,2013,24(1):34 − 41.
[29] 陈兵红,靳全锋,柴红玲,郭福涛. 浙江省大气PM2.5时空分布及相关因子分析[J]. 环境科学学报,2021,41(3):817 − 829. doi: 10.13671/j.hjkxxb.2020.0295. [30] STOW D ,DAESCHNER S,HOPE A,et al. Variability of the seasonally integrated normalized difference vegetation index across the north slope of alaska in the 1990s[J]. International Journal of Remote Sensing,2003,24(5):1111 − 1117.
[31] SUN Y L,SHAN M,PEI X R,et al. Assessment of the impacts of climate change and human activities on vegetation cover change in the Haihe River basin,China[J]. Physics and Chemistry of the Earth Parts A,2020,115:1028 − 1034.
[32] SEN,KUMAR P. Estimates of the regression coefficient based on Kendall’s Tau[J]. Publications of the American statistical association,1968,63(324):1379 − 1389. doi: 10.1080/01621459.1968.10480934
[33] MANN H B . Non-parametric tests against trend[J/OL]. Econometrica,13:245–259. https://link.springer.com/article/10.1007/s00704-018-2439-z.
[34] RAHIMABADI P D,AZARNIVAND H. Assessment of the effect of climate fluctuations and human activities on vegetation dynamics and its vulnerability[J]. Theoretical and Applied Climatology,2023(1):153 − 165.
[35] YU H,L Y . Insights on the roles of climate and human activities to vegetation degradation and restoration in Beijing-Tianjin sandstorm source region[J]. The Journal of Ecotechnology,2021,159(1):105 − 112.
[36] NING T,LIU W,LIN W,et al. NDVI variation and its responses to climate change on the Northern Loess Plateau of China from 1998 to 2012[J]. Advances in Meteorology,2015(1):1 − 10.
[37] WEI L H,MA W,ZHUANG Y L,et al. The impacts of climate change and human activities on alpine vegetation and permafrost in the Qinghai-Tibet Engineering Corridor[J]. Ecological indicators:Integrating,monitoring,assessment and management,2018(10):24 − 35.
[38] WANG W H,MA X Q,SYED M N,et al. Anthropogenic and biophysical factors associated with vegetation restoration in Changting,China[J]. Forests,2018,9(6):306 − 319. doi: 10.3390/f9060306


计量
- 文章访问数: 25
- HTML全文浏览量: 3
- PDF下载量: 2
